Use the search engine below to find a specific content.
Monitoring performance of Veterinary Services
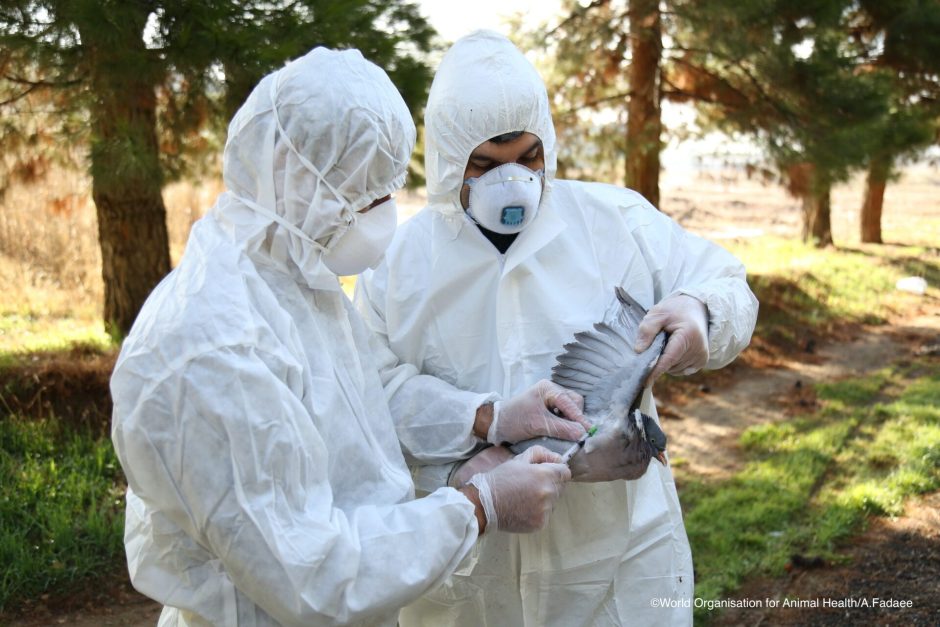
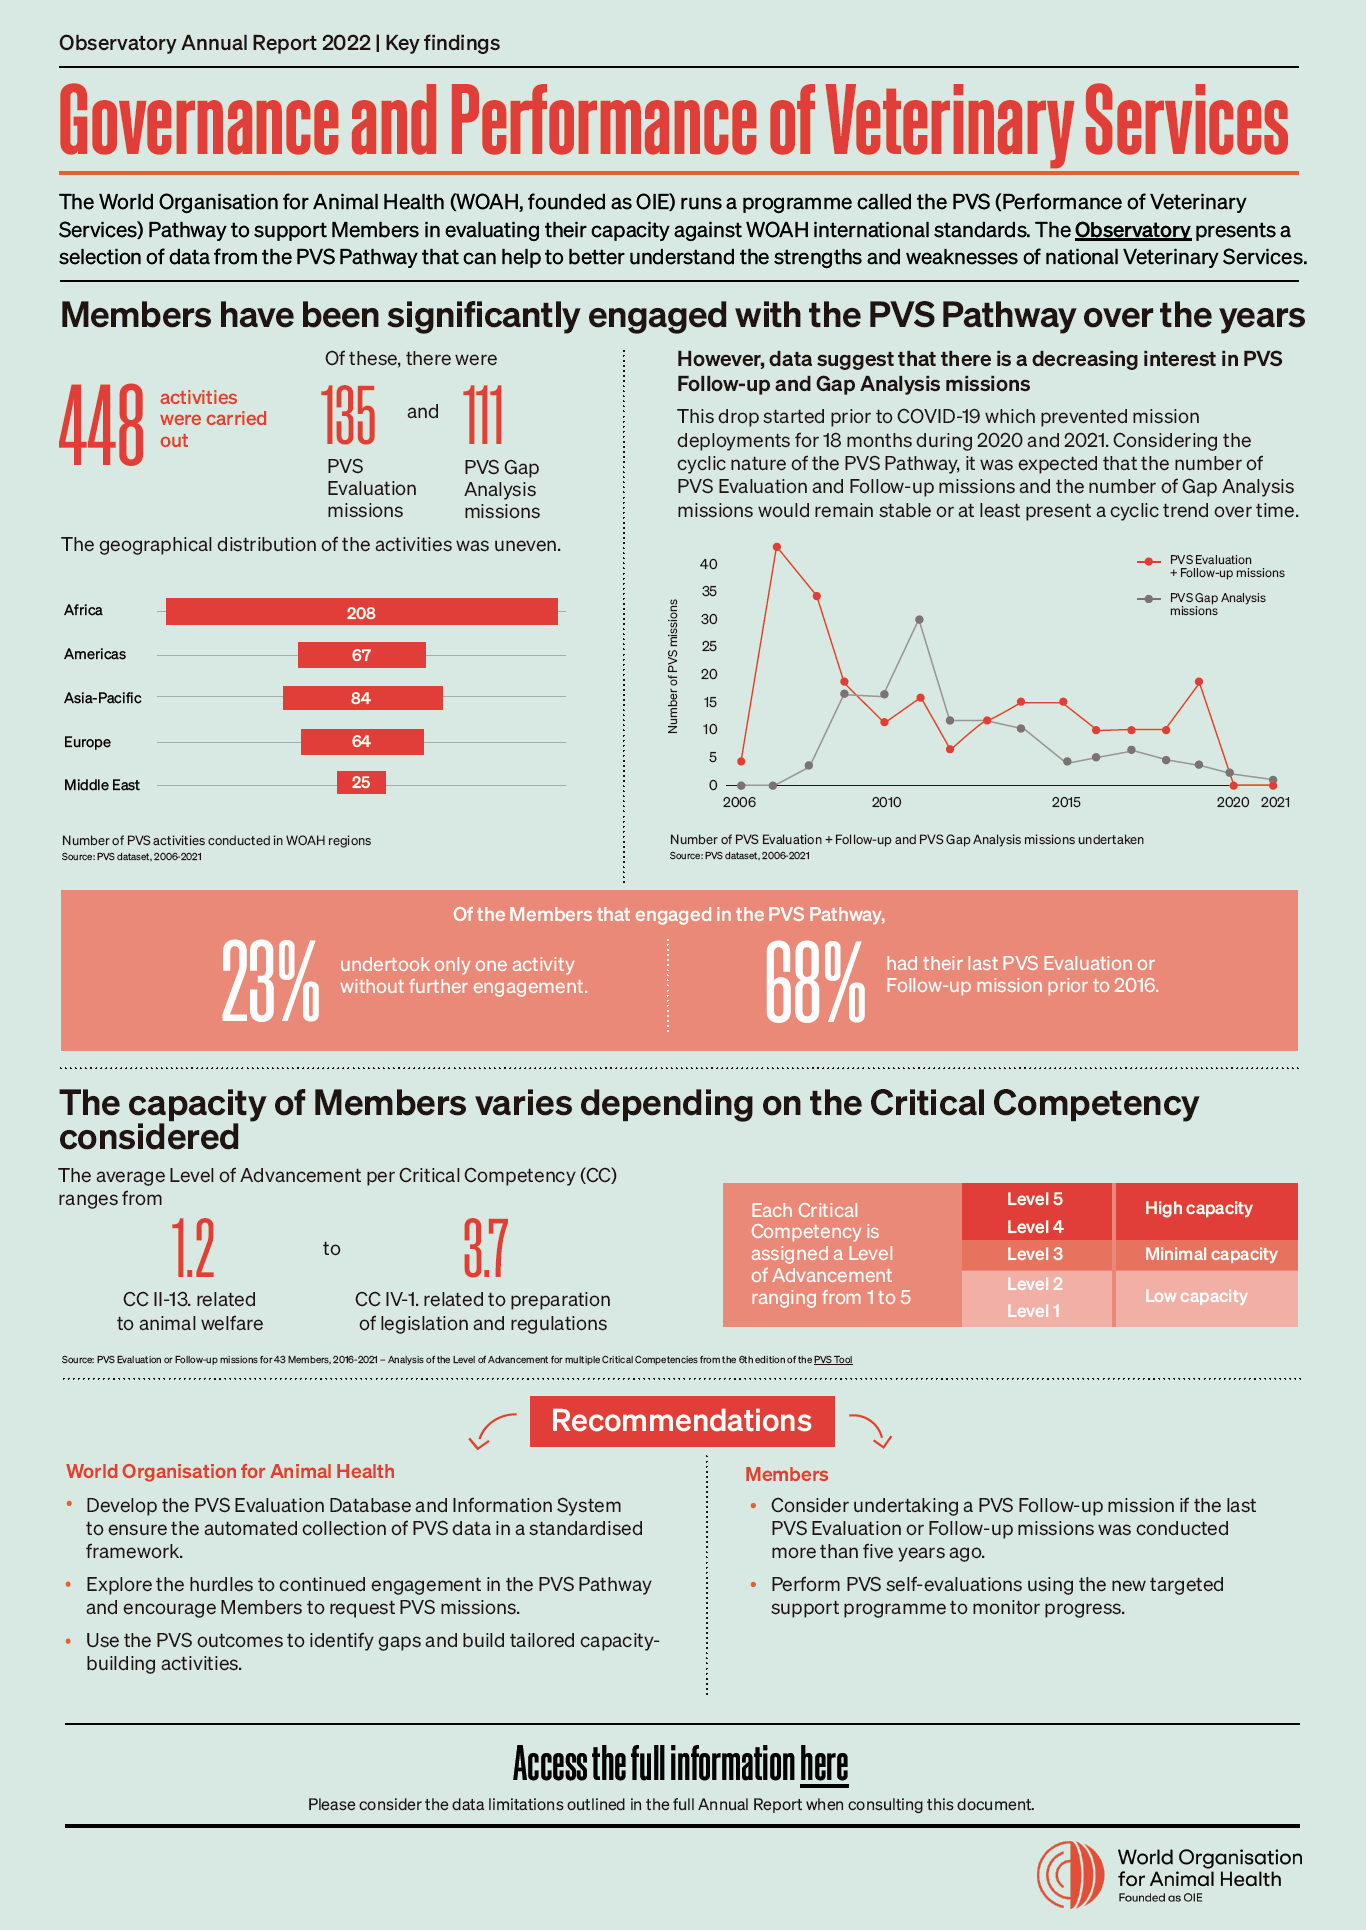
To support Members in evaluating their performance against the international standards provided by the World Organisation for Animal Health (WOAH), the WOAH Tool for the Evaluation of Performance of Veterinary Services (PVS Tool) was developed in 2006. This was followed by the PVS Tool Aquatic in 2013 to specifically evaluate the services in charge of aquatic animal health. Both Tools are part of a broader programme supporting the strengthening of Veterinary Services, called the PVS Pathway.
Monitoring performance of Veterinary Services against standards can bring valuable insights both for WOAH and WOAH Members. Through its Annual Report, the Observatory presents a selection of PVS Pathway data that can help better understand the strengths and weaknesses in the performance and governance of Members’ Veterinary Services.
How can you access our veterinary performance analysis?
The veterinary performance dashboard presents the results of the analysis in an interactive way.
To discover the results of our veterinary performance analysis, access the full report as well as the one-page executive summary.
Observatory Annual Report |
First Edition, 2022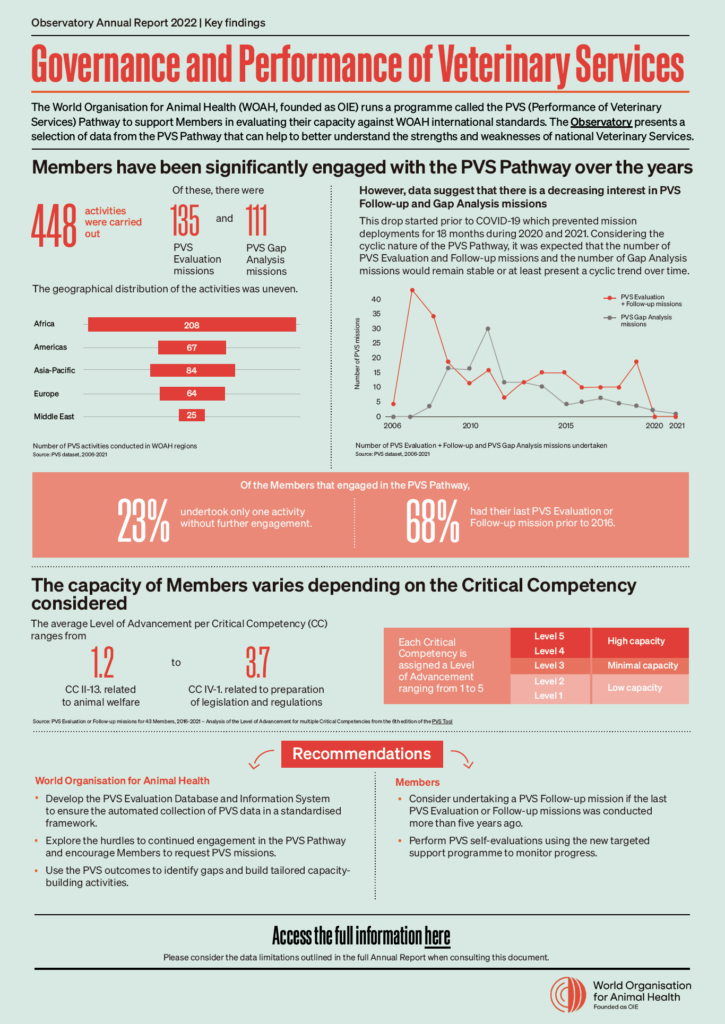
Observatory Annual Report 2022 |
Executive summary
How did we monitor the implementation of standards related to performance of Veterinary Services?
Monitoring the implementation of standards related to governance and performance of Veterinary Services requires building and analysing indicators using various data sources.
What veterinary performance indicators did we use to monitor the implementation of these standards?
Several indicators made it possible to monitor the implementation of standards related to governance and performance of Veterinary Services, among them:
Members’ engagement in the PVS Pathway:
Number of Members that have received a PVS mission
Percentage of Members that have engaged in PVS Activities (at least one Activity), in each WOAH region
Number of requests received for PVS Activities (already undertaken or planned)
Number of PVS Activities undertaken
Members’ continued engagement in the PVS Pathway:
Number of Members that have had a PVS Evaluation/Follow-up mission between 2016 and 2021
Percentage of Members that have had a PVS Evaluation/Follow-up mission between 2016 and 2021
Number of Members that had their last PVS Evaluation/Follow-up mission before 2016 (and could consider the need for a Follow-up mission)
Percentage of Members that had their last PVS Evaluation/Follow-up mission before 2016 (and could consider the need for a Follow-up mission)
Number of Members that have had only one PVS Evaluation (and no further PVS engagement) since 2006
Percentage of Members that have had only one PVS Evaluation (and no further PVS engagement) since 2006
Members’ performance – Levels of Advancement:
Distribution of the Levels of Advancement for each Critical Competency
Average Levels of Advancement for each Critical Competency
Percentage of Members that have a Level of Advancement of 3 or more for a given Critical Competency.
What data sources did we use to build workforce and resources indicators?
Two main data sources made it possible to build the monitoring indicators:
Members’ engagement in the PVS Pathway:
Official requests received from Members and missions undertaken, as indicated in the PVS Mission dataset managed by the Capacity Building Department, WOAH, since 2006
Performance of Veterinary Services:
Levels of Advancement of Critical Competencies (from the PVS Tool). The dataset was compiled and provided by the Capacity Building Department, WOAH. For easy reference, the identifying numbers of the Critical Competencies used in this report are based on the Sixth Edition of the PVS Tool (2013) and the First Edition of the PVS Aquatic Tool (2013). PVS Evaluation and Follow-up missions conducted between 2016 and 2021 were considered
More on the topic
-

Observatory
The Observatory is a transversal programme that provides an overview of the uptake of international standards on animal health and welfare and veterinary public health by our Members. It contributes to the progressive improvement of their implementation as well as to the constant assessment of our corporate initiatives by providing valuable feedback and recommendations.Discover -
PVS Pathway
The PVS Pathway for the sustainable improvement of national Veterinary Services and Aquatic Animal Health Services is our flagship capacity building programme. An independent and in-depth monitoring mechanism of the performance of these Services makes it possible to identify their strengths and areas for improvement, and to recommend solutions specifically adapted to each country for sustainable improvement and investment.Discover